Runbook Practical Cookbook & Recipes
Step-by-step practical recipes and power workflows for Runbook.
Step-by-step operational recipes for Runbook on macOS. Each recipe pairs UI workflows with production-ready YAML patterns so you can author, test, schedule, and audit infrastructure automation with confidence.
View on GitHub 📖 Open User Guide →
Table of Contents
- Recipe 1: Zero-Downtime Cluster Rollout with 1Password Secrets & Pre-Flight Gate
- Recipe 2: Fast Iteration with Dry-Run Previews & In-Place Tray Retries
- Recipe 3: Modal Vim Editing, Inline Code Popouts & Pre-Save LCS Diffs
- Recipe 4: Multi-Cadence Cron Scheduling with
--varOverrides & Pipeline Inspection - Recipe 5: Post-Incident Triage with Run-Scoped Step Log Extraction
- Recipe 6: Standardizing Team Playbooks via Pulled Git Collections & Templates
- Recipe 7: Customizing Console Output Highlighting (
~/.runbook/highlights.yaml)
Recipe 1: Zero-Downtime Cluster Rollout with 1Password Secrets & Pre-Flight Gate
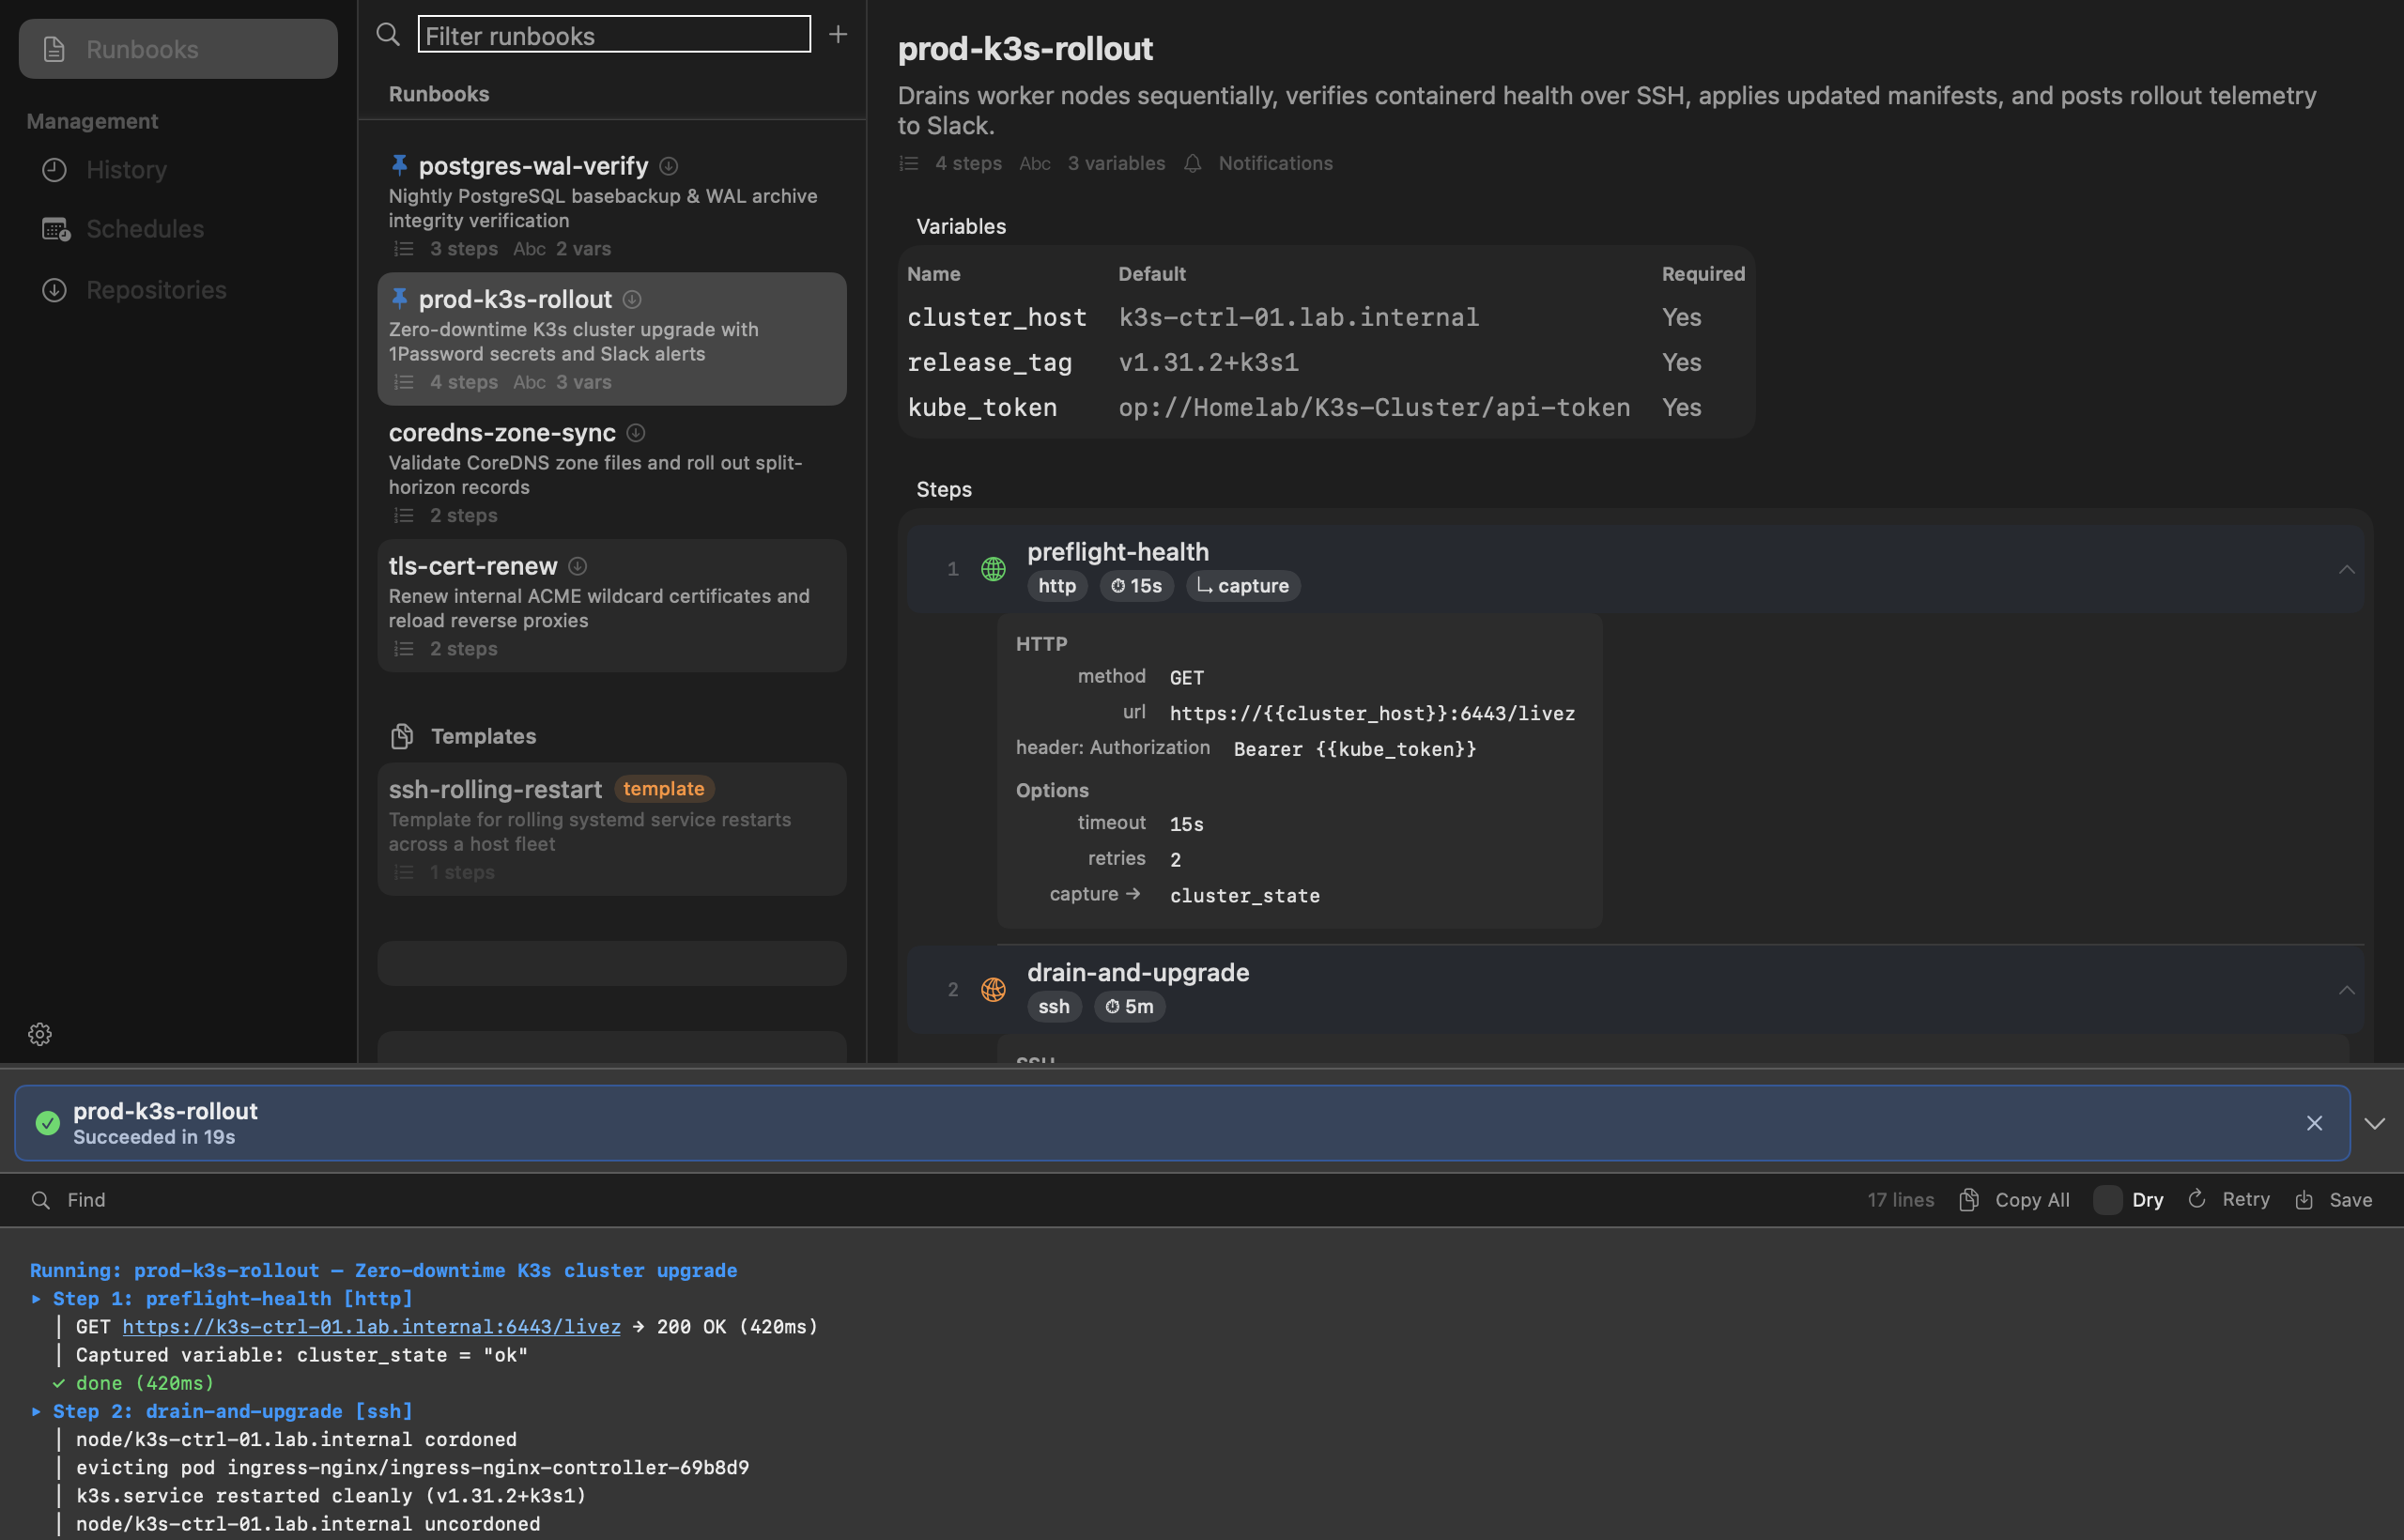
Goal: Build a multi-step rollout playbook that probes an HTTP health endpoint using a 1Password bearer token, captures the cluster state, drains and restarts nodes over SSH, and posts an audit payload on completion.
Step-by-Step
- Click
+in the Runbook list filter bar (⌘N) and select Blank. - Name the runbook
prod-k3s-rolloutand paste the following YAML:
name: prod-k3s-rollout
summary: Zero-downtime K3s cluster upgrade with 1Password secrets and Slack alerts
variables:
  - name: cluster_host
    default: k3s-ctrl-01.lab.internal
    required: true
  - name: release_tag
    default: v1.31.2+k3s1
    required: true
  - name: kube_token
    default: op://Homelab/K3s-Cluster/api-token
    required: true
    secret: true
steps:
  - name: preflight-health
    type: http
    timeout: 15s
    retries: 2
    capture: cluster_state
    http:
      method: GET
      url: https://{{cluster_host}}:6443/livez
      headers:
        Authorization: Bearer {{kube_token}}
  - name: drain-and-upgrade
    type: ssh
    timeout: 5m
    on_error: abort
    ssh:
      host: "{{cluster_host}}"
      user: ops
      agent_auth: true
      command: |
        kubectl drain {{cluster_host}} --ignore-daemonsets --delete-emptydir-data
        sudo systemctl restart k3s
        kubectl uncordon {{cluster_host}}
  - name: verify-workloads
    type: shell
    timeout: 45s
    condition: "{{cluster_state}} != ''"
    shell:
      dir: ~/workspace/infra/k3s
      command: |
        kubectl get nodes -o wide
        kubectl rollout status deployment/ingress-nginx-controller -n ingress-nginx
notify:
  on: failure
  desktop: true
  slack:
    webhook: op://Homelab/Slack/ops-webhook
    channel: "#infra-alerts"
- Click Validate to verify schema integrity, then click Create.
- Right-click
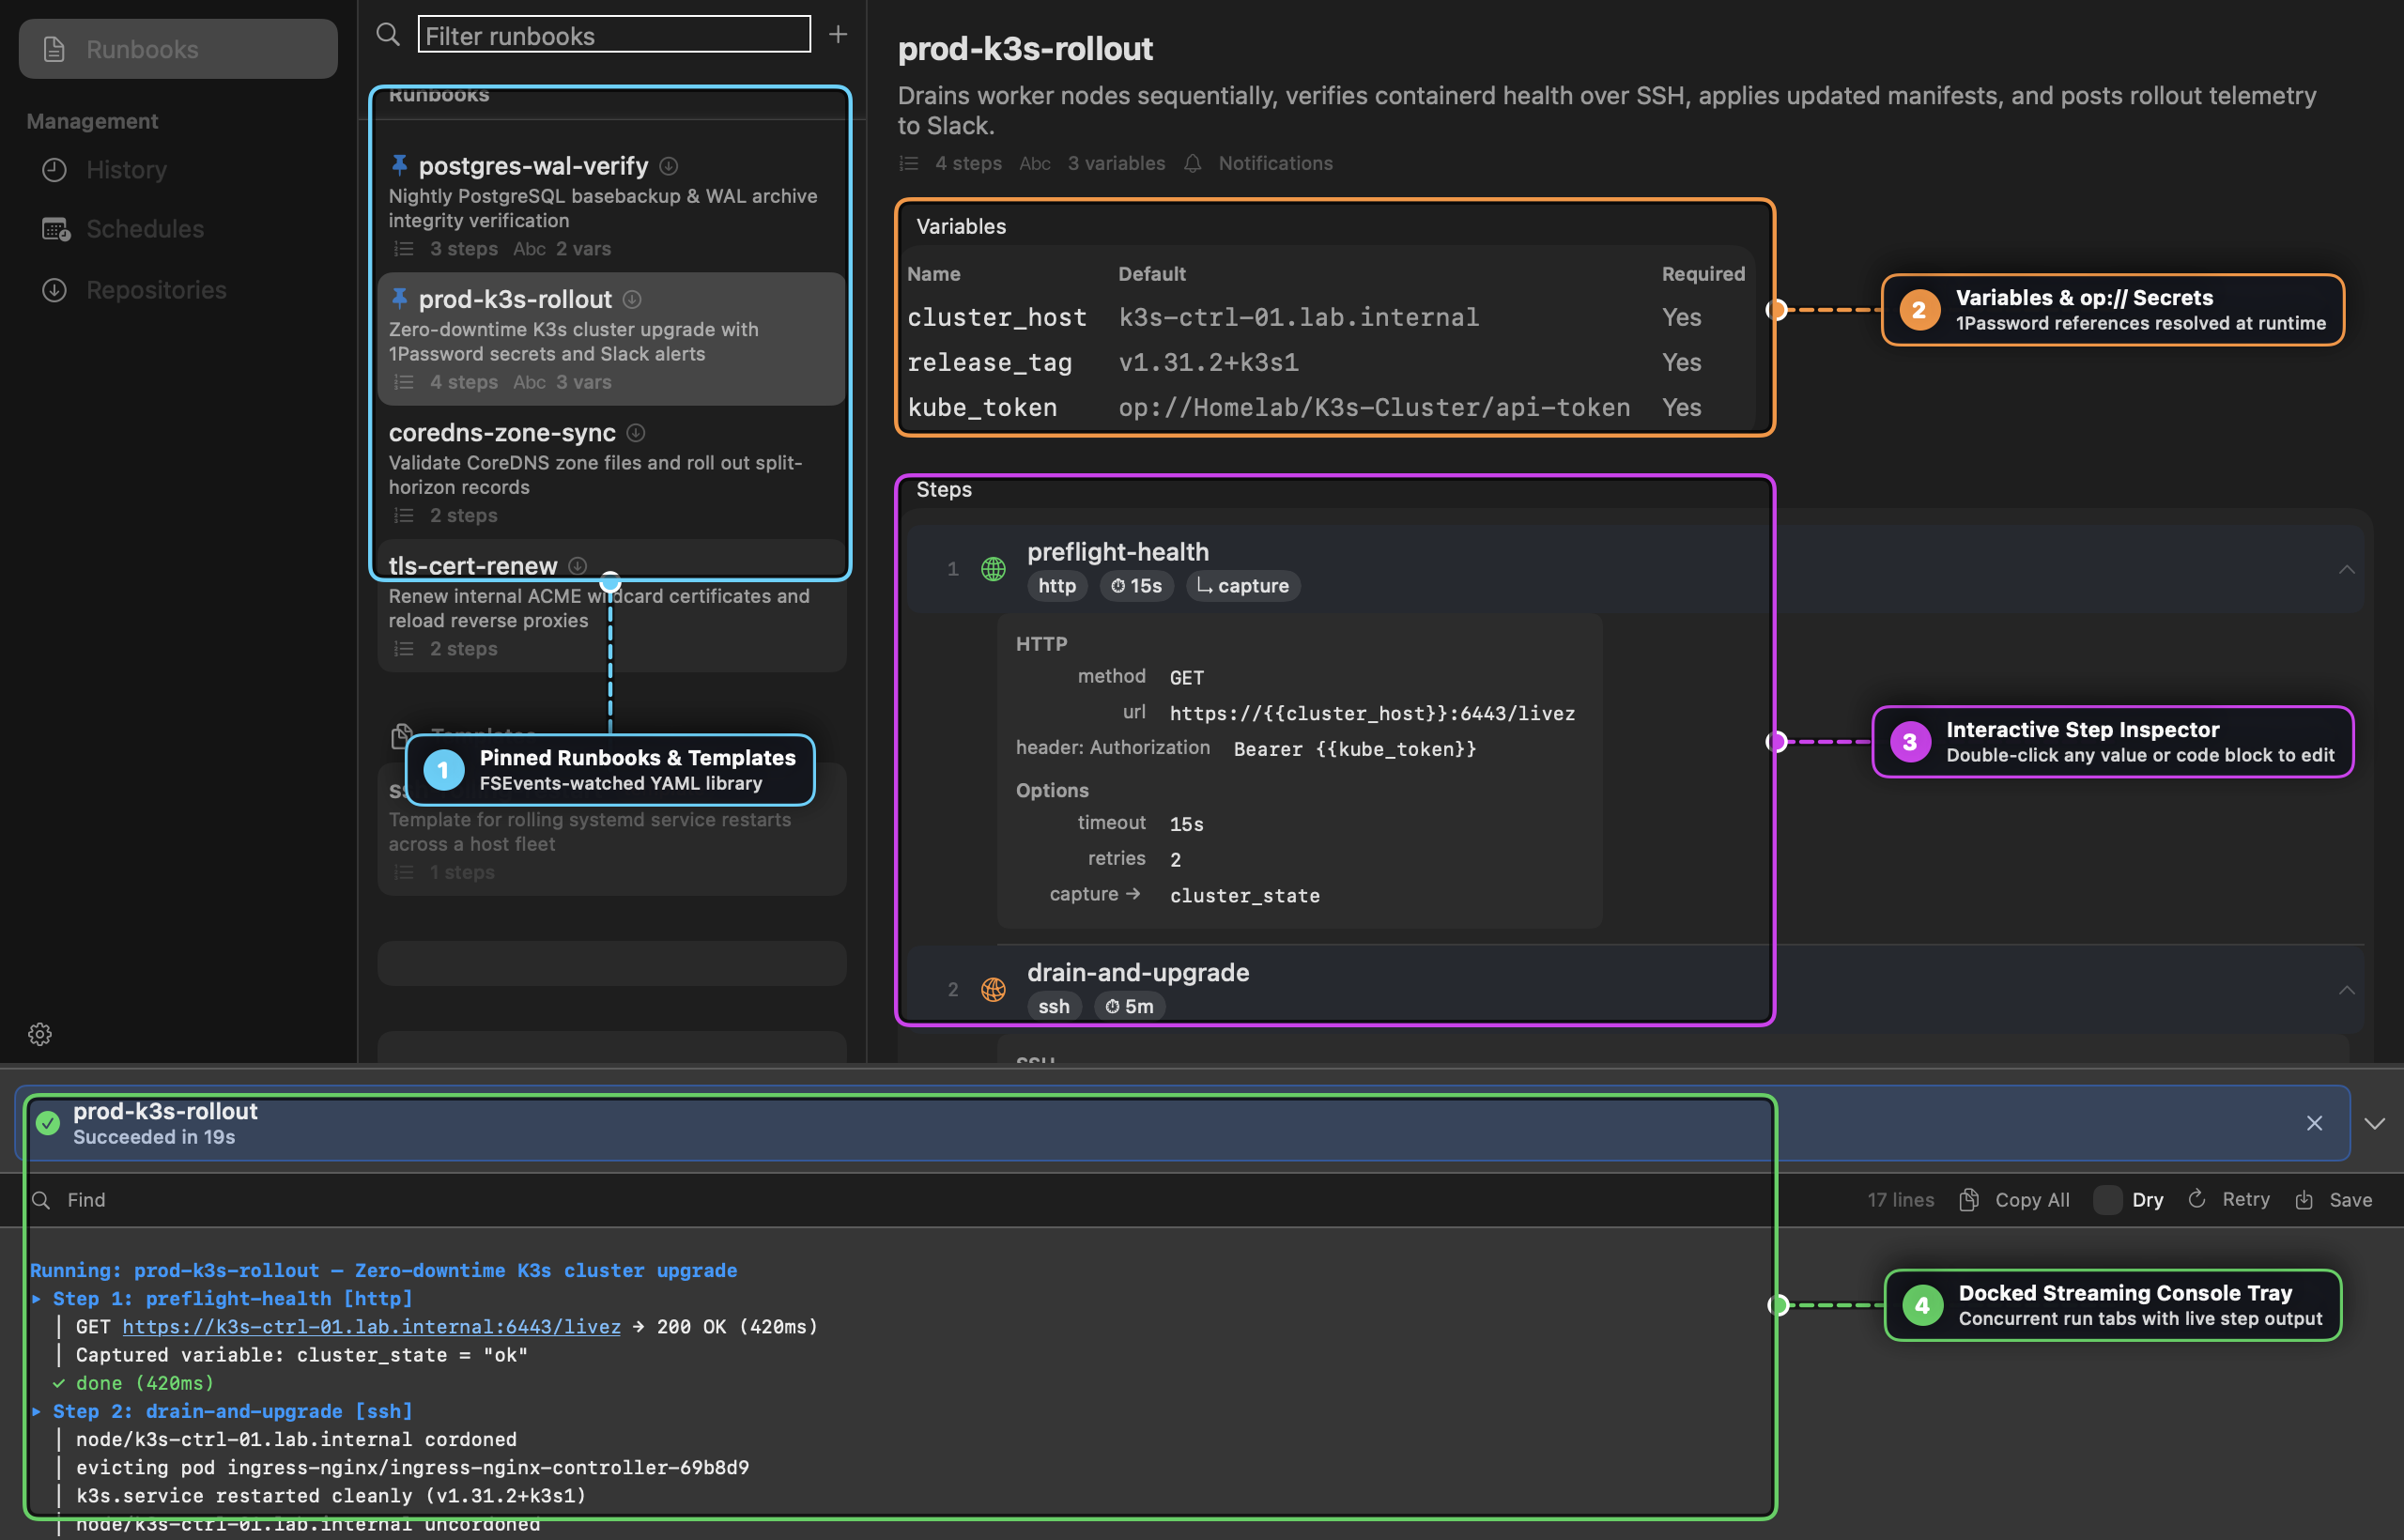
prod-k3s-rolloutin the list and select Pin so it stays anchored at the top of your library (Callout 1). - Click Run in the top-right toolbar. Notice in the Variables card (Callout 2) and Run Confirm Sheet that
op://Homelab/K3s-Cluster/api-tokenis never exposed in plaintext—the CLI resolves it at runtime and caches it in the macOS Keychain.
Recipe 2: Fast Iteration with Dry-Run Previews & In-Place Tray Retries
Goal: Verify variable interpolation and step execution order without mutating remote hosts, then flip immediately to a live run from the console tray.
Step-by-Step
- Select a runbook and click Run (or right-click the row and choose Dry Run).
- In the Run Confirm Sheet, check Dry Run and click Dry Run.
- The Console Tray (Callout 4 in the workbench screenshot) slides open at the bottom of the window, displaying the resolved variable map and planned step execution sequence with a
drybadge in the session tab. - Once the dry run finishes (
✓ Succeeded), look at the right side of the console tray’s bottom toolbar:- Uncheck the inline Dry checkbox next to Retry.
- Click Retry.
- Runbook clears the tab’s buffer, resets the elapsed timer, and executes the real run in place within the same tab.
[!NOTE] Concurrent Execution: You never have to wait for a slow rollout to finish before starting another task. Navigate to any other runbook and click Run—a new session tab appears in
SessionTabBarso you can monitor multiple playbooks in parallel.
Recipe 3: Modal Vim Editing, Inline Code Popouts & Pre-Save LCS Diffs
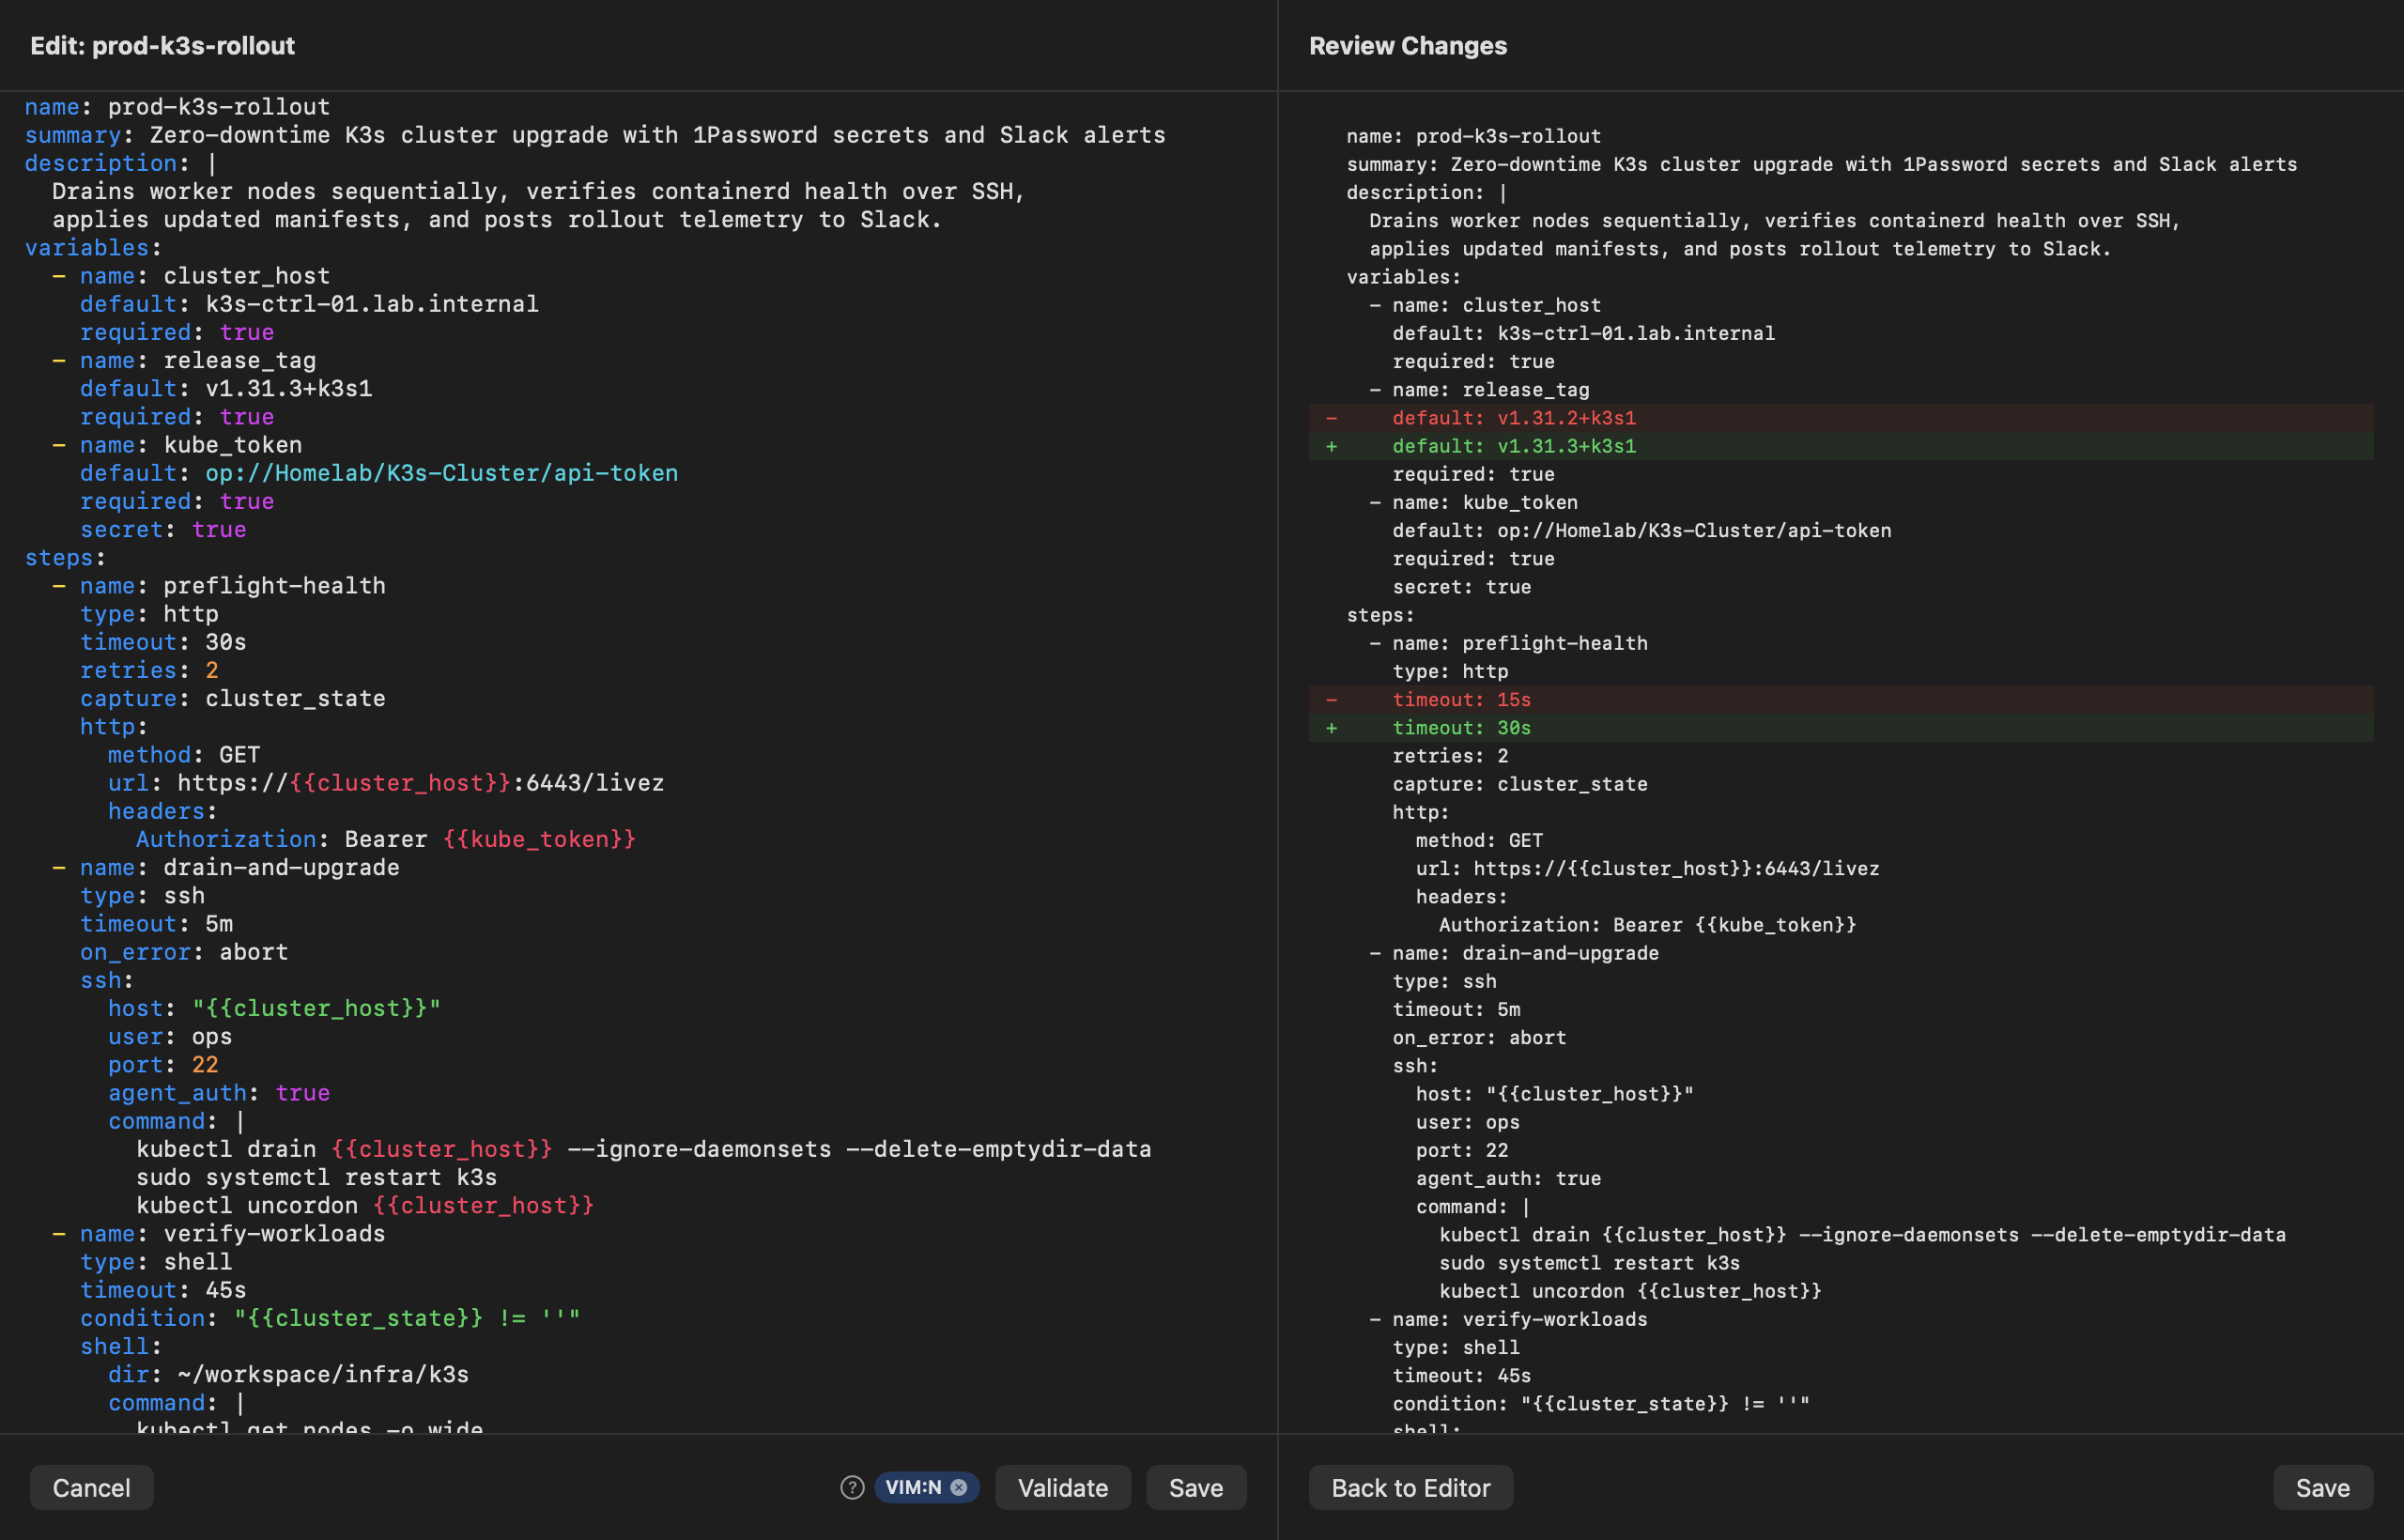
Goal: Edit complex YAML configurations or embedded multi-line Bash/JSON payloads using modal Vim keybindings and verify exact line changes before writing to disk.
Step-by-Step
- Inline Field Tweaks: In
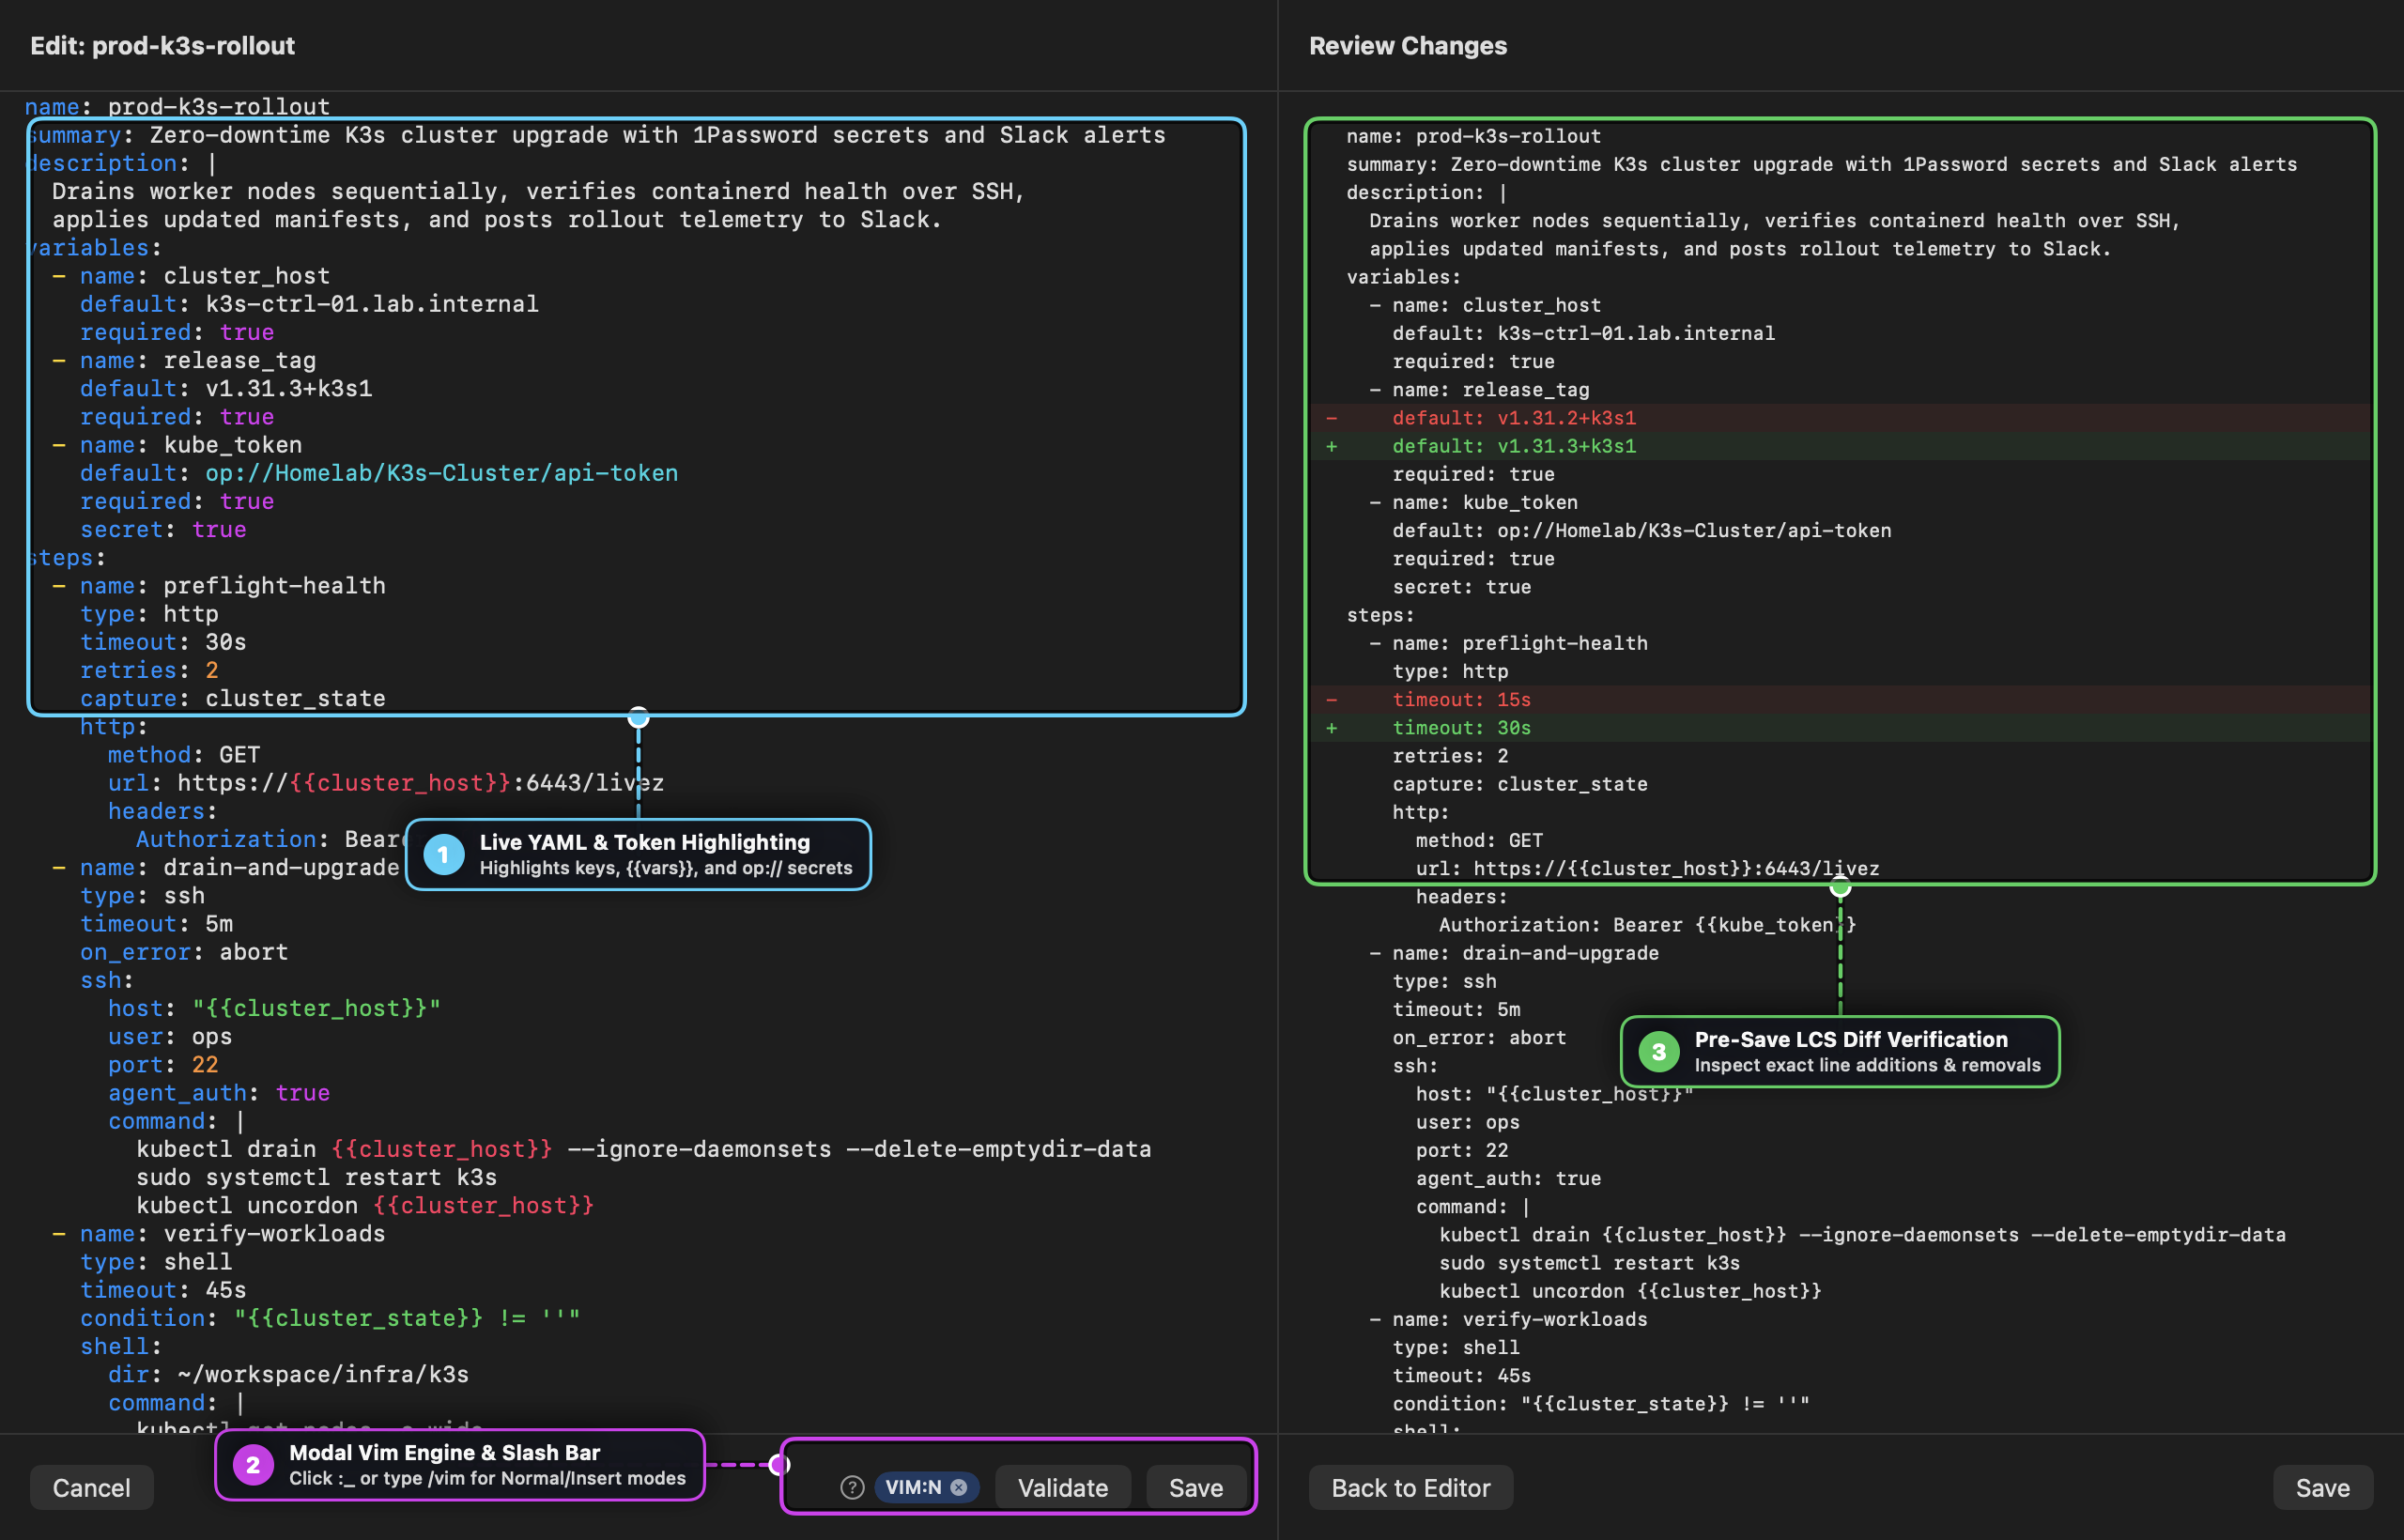
RunbookDetailView, expand any step and double-click a single-line field (such astimeoutorhost) to edit it in place, or double-click a multilinecommand/bodyblock to open the 900×520 syntax-highlighted popout editor. - Full YAML Editing: Click the Edit (pencil) button in the detail toolbar to open
EditorView(Callout 1). - Activate Modal Vim Mode:
- Click the
:_watermark button in the bottom bar (Callout 2) or type/vimat the start of a line and pressReturn. - The
VIM:Ncapsule badge appears alongside the?cheatsheet button. Use standard Vim motions (w,b,f,ci",dd,/search,.) to make your edits.
- Click the
- Review Pre-Save Diff:
- Type
:w<Return>in Vim Normal mode or click Save. - The Review Changes diff sheet (Callout 3) highlights removed lines in red (
-) and added lines in green (+). - Click Save to commit the change (automatically archiving the prior version in
~/.runbook/backups/).
- Type
Recipe 4: Multi-Cadence Cron Scheduling with --var Overrides & Pipeline Inspection
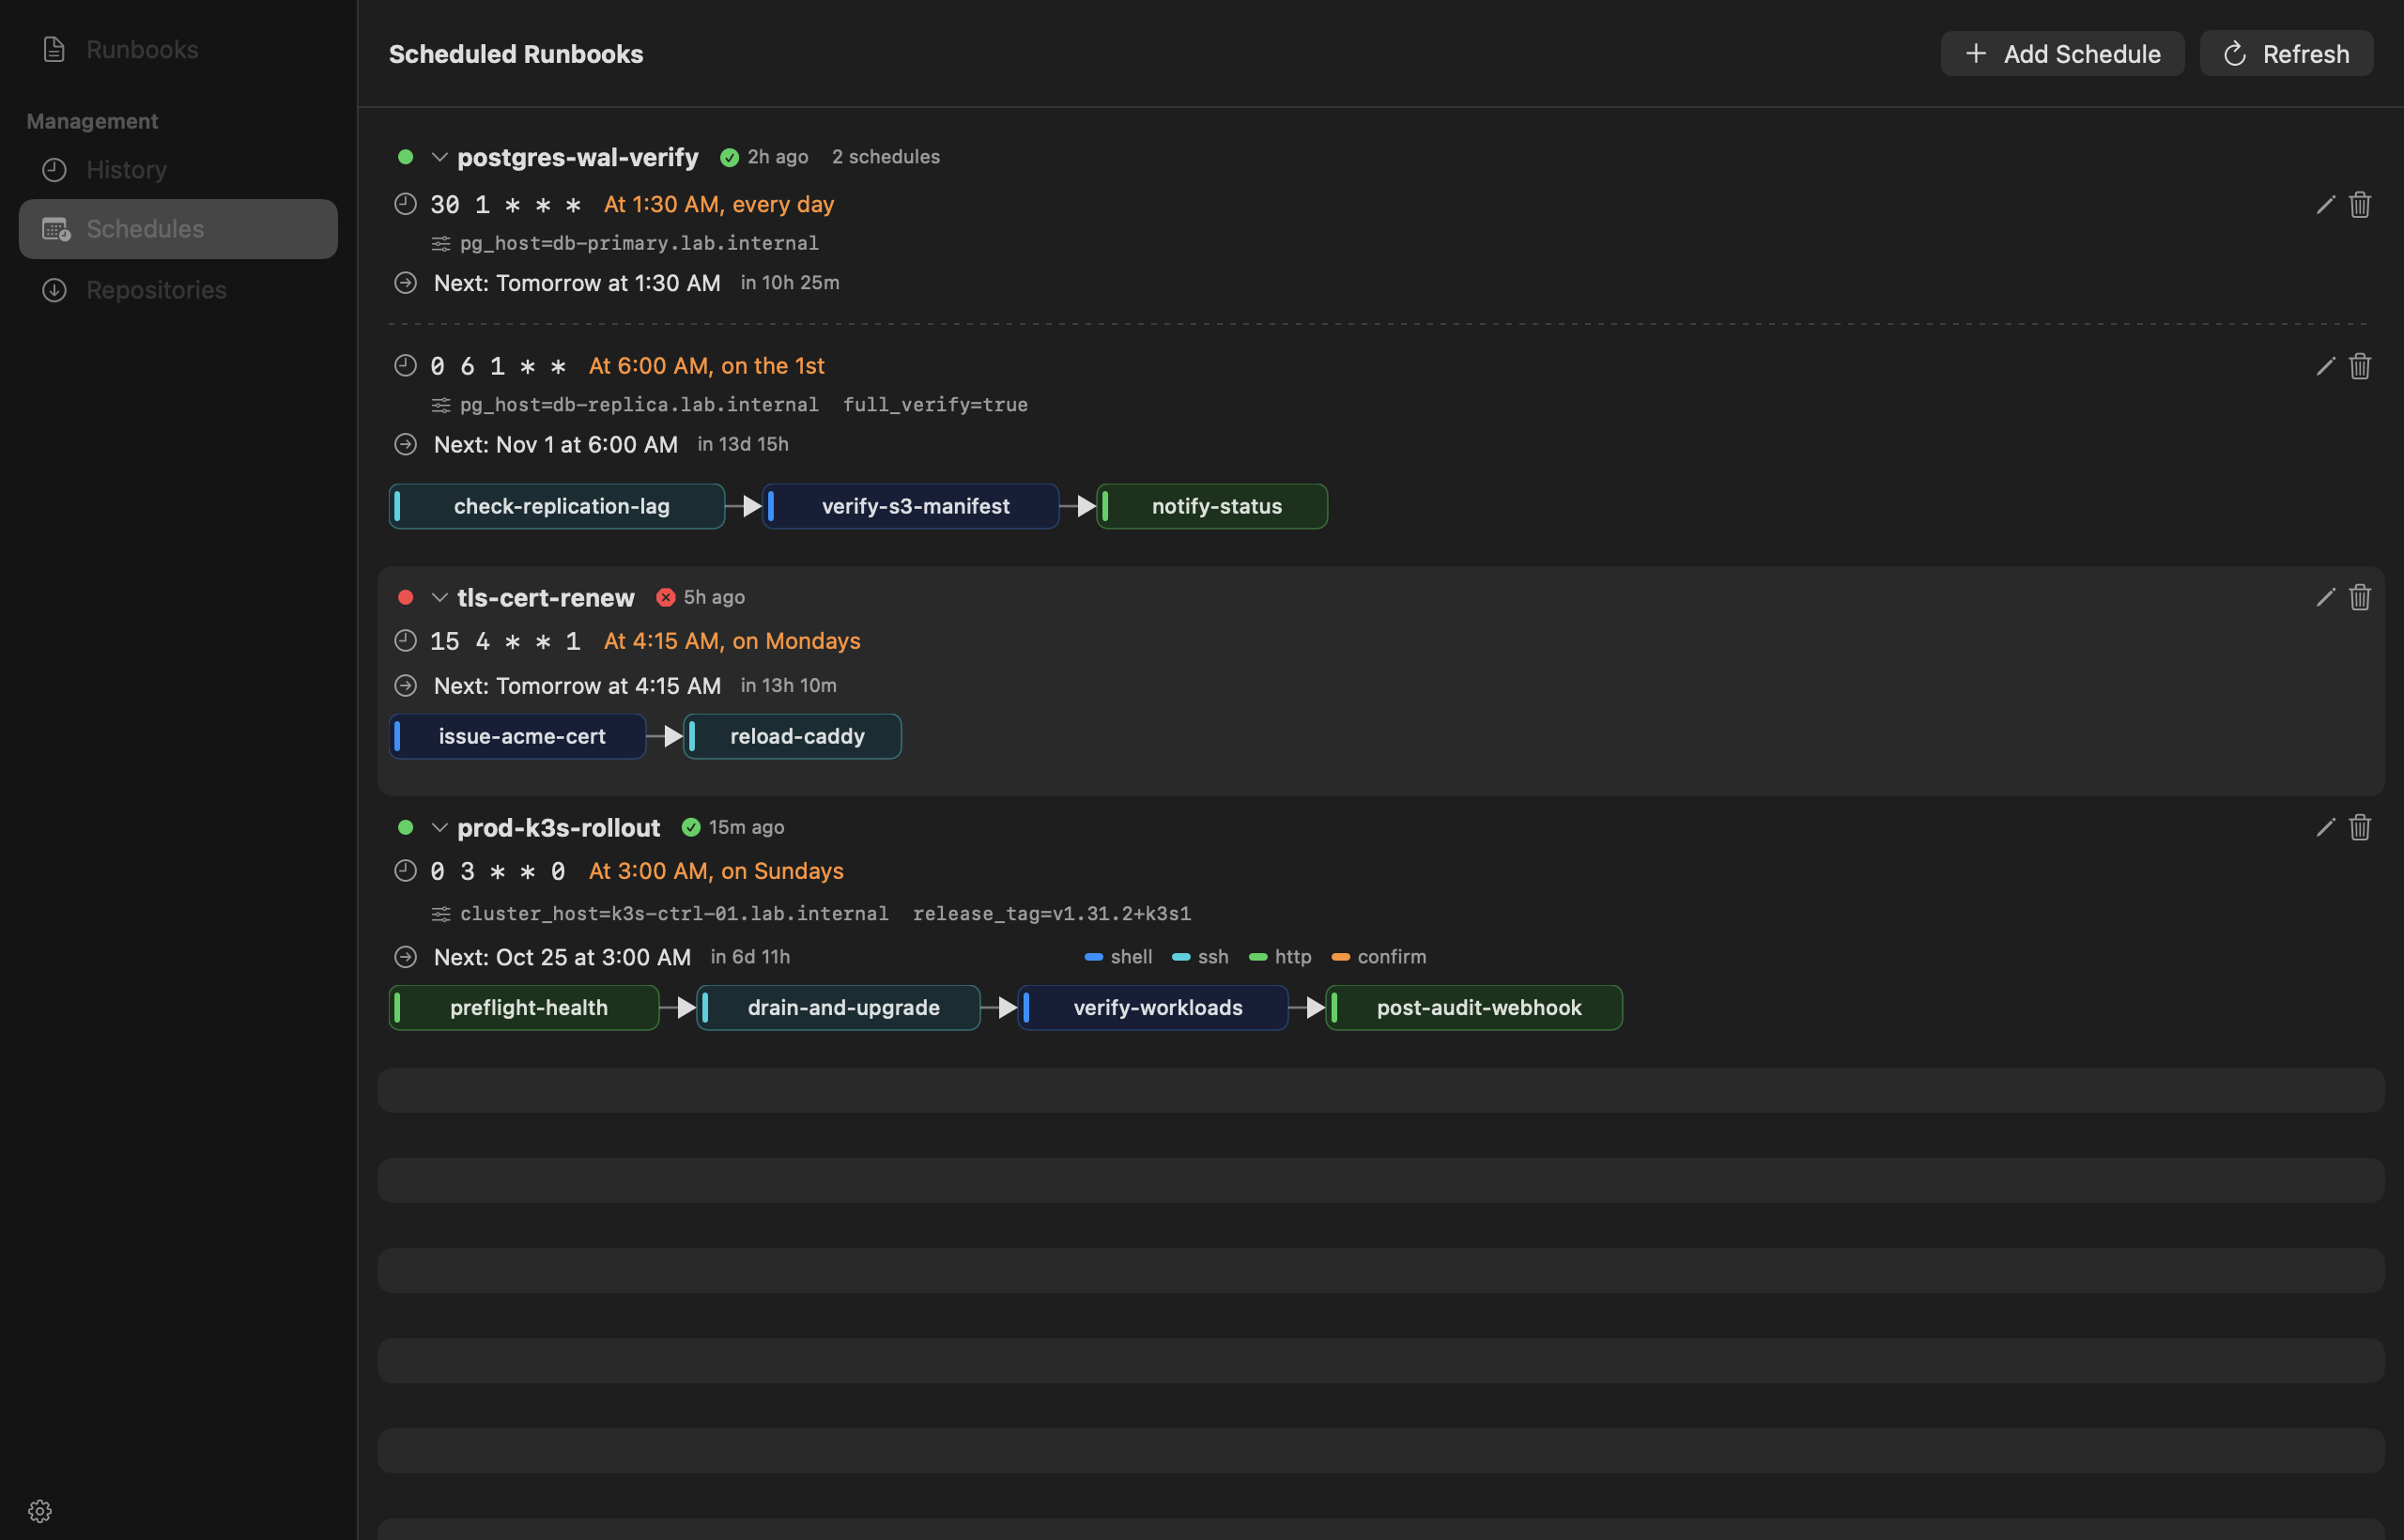
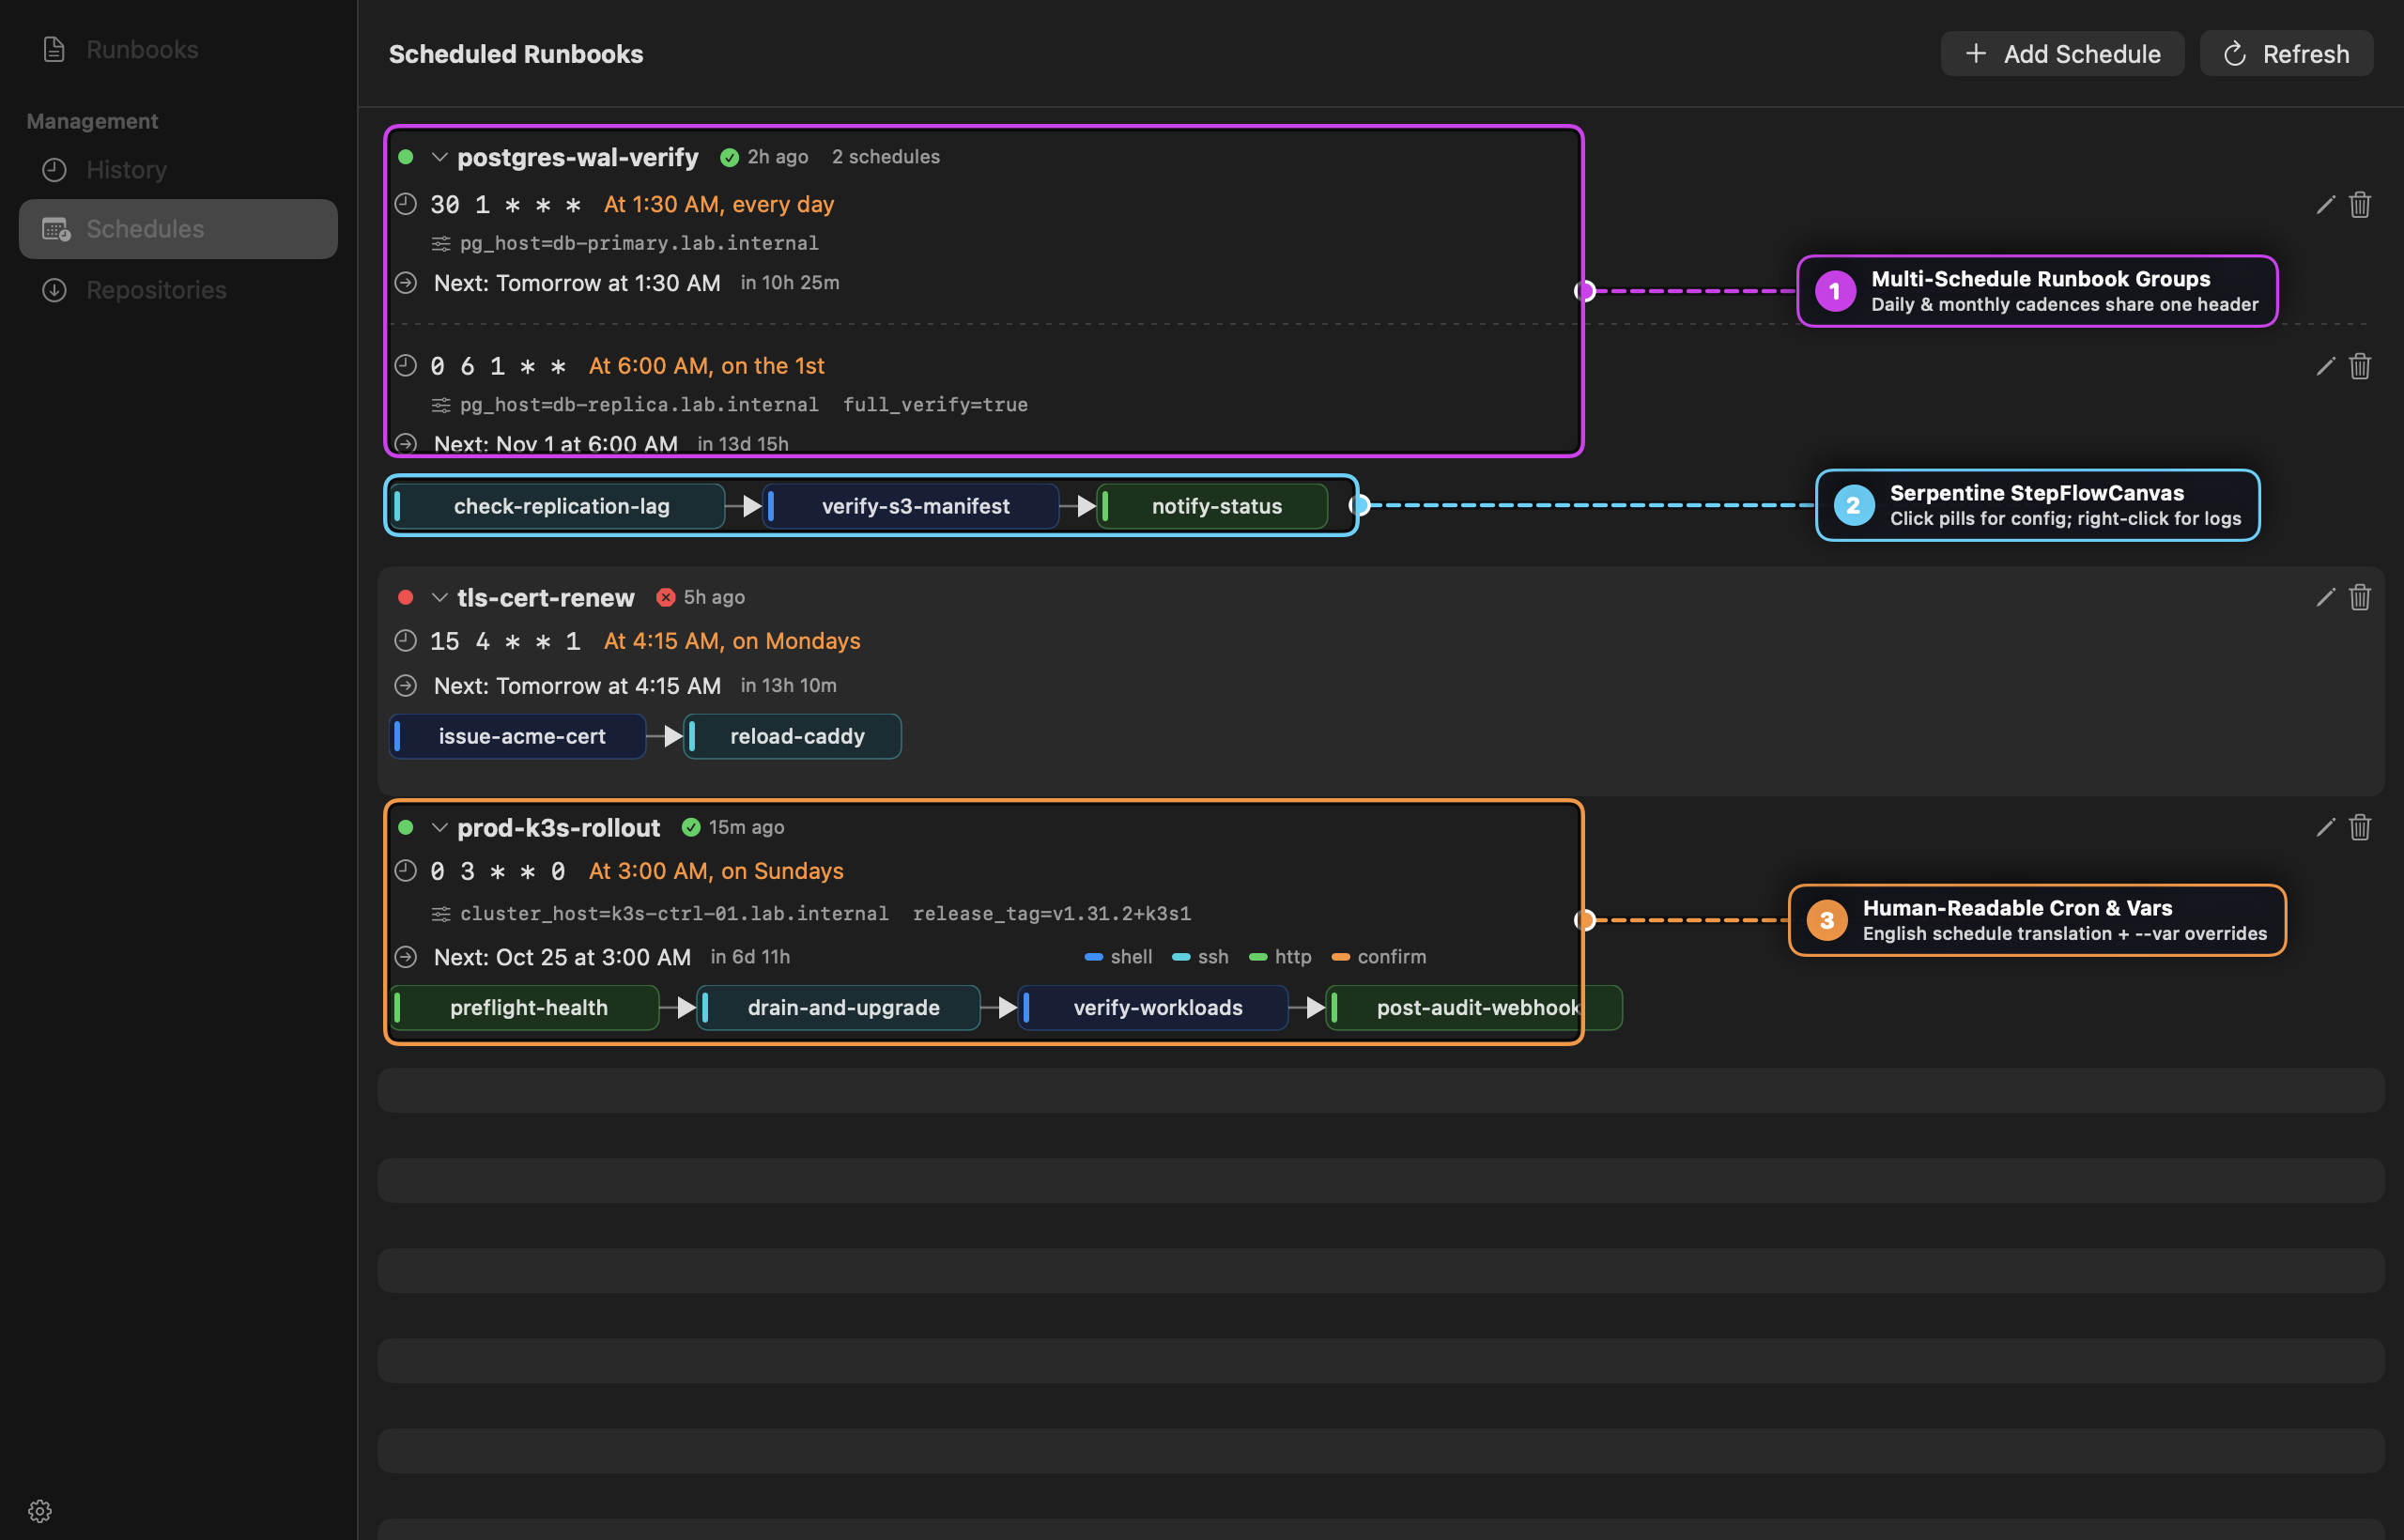
Goal: Schedule a database verification runbook to run both nightly (against a primary host) and on the 1st of every month (against a replica with full verification enabled), and inspect its step pipeline visually.
Step-by-Step
- Open Schedules (
⌘3) in the sidebar and click Add Schedule. - Select
postgres-wal-verify, enter30 1 * * *, and add a variable overridepg_host=db-primary.lab.internal. - Click Add Schedule a second time for
postgres-wal-verify, enter0 6 1 * *, and addpg_host=db-replica.lab.internalandfull_verify=true. - Runbook automatically merges both schedules into a Multi-Schedule Runbook Group (Callout 1), displaying each schedule’s plain-English translation, next-run countdown, and
--varoverrides above a single sharedStepFlowCanvas(Callout 2). - Interact directly with the serpentine pipeline:
- Left-click any step pill (
check-replication-lag) to inspect its SSH/Shell configuration. - Right-click any step pill to view the stdout/stderr slice from the most recent run of that step.
- Double-click any step pill to jump straight to
RunbookDetailViewwith that step expanded.
- Left-click any step pill (
[!IMPORTANT] Pre-Warming 1Password Secrets for Unattended Runs: Cron jobs run without an interactive TTY (
--no-tui --yes). Before scheduling a runbook that referencesop://secrets, runrunbook auth <runbook-name>in your terminal (or click Pre-warm in Settings → Credentials) so the secret is cached in your login Keychain.
Recipe 5: Post-Incident Triage with Run-Scoped Step Log Extraction
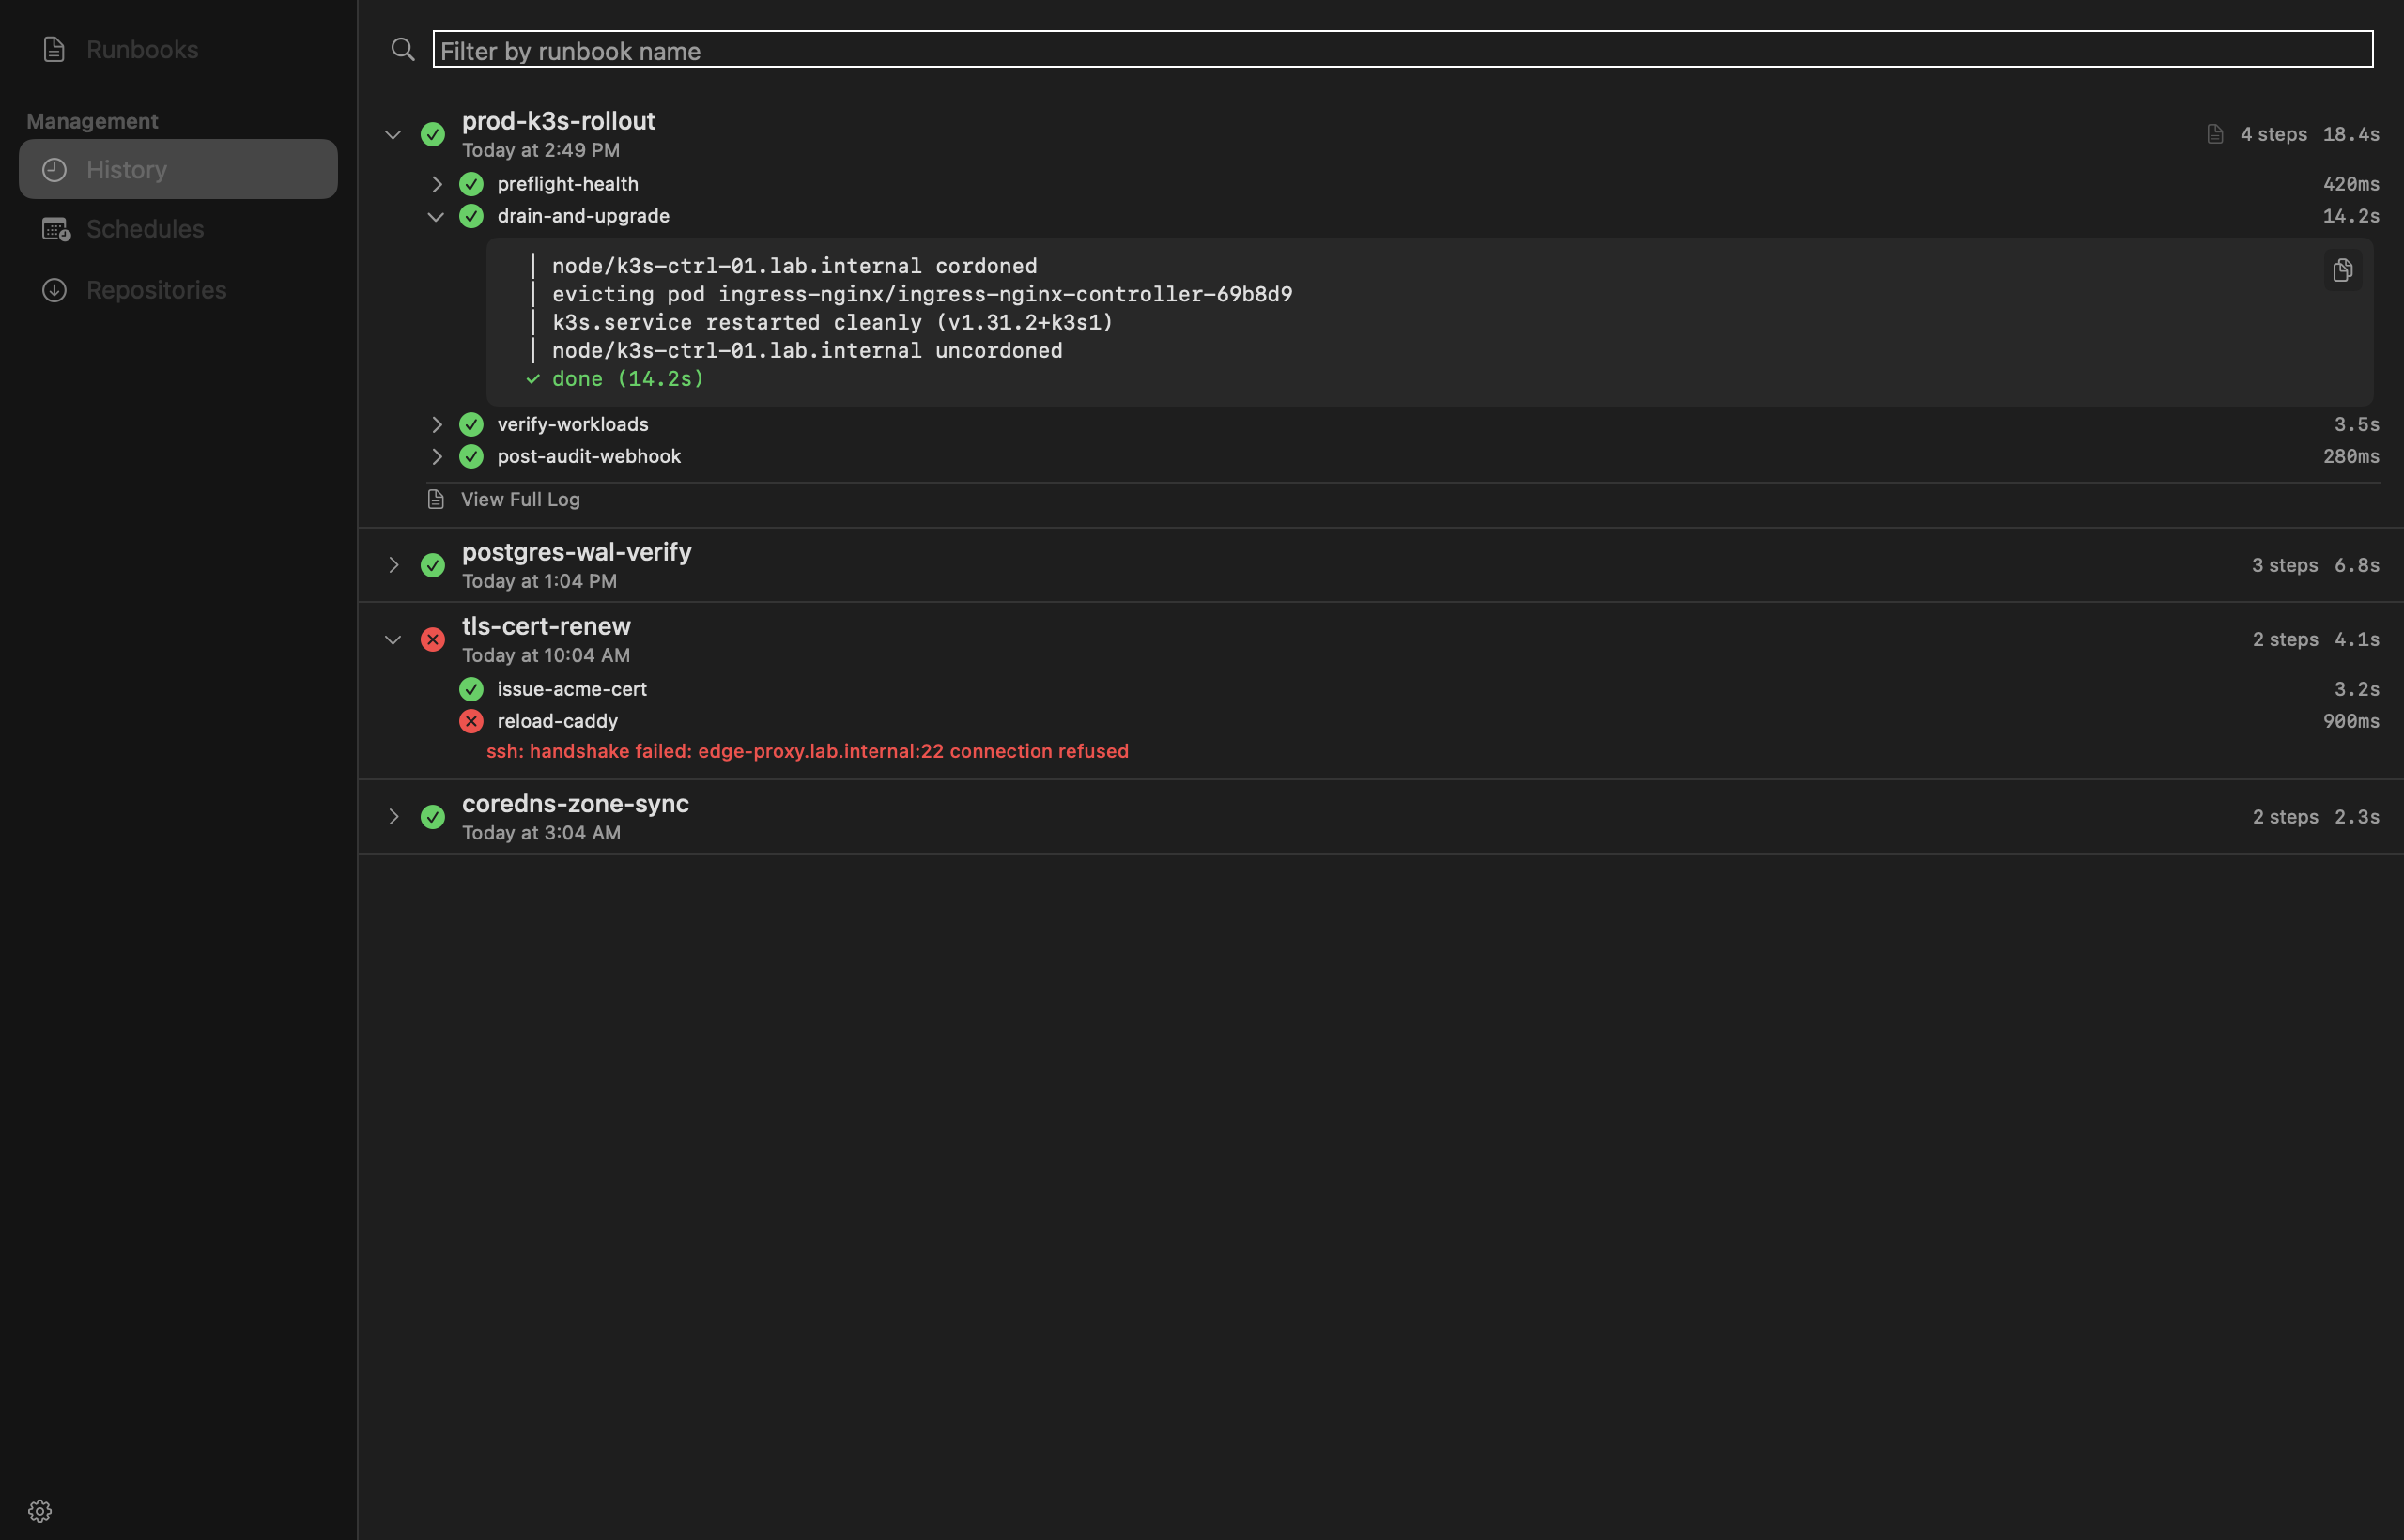
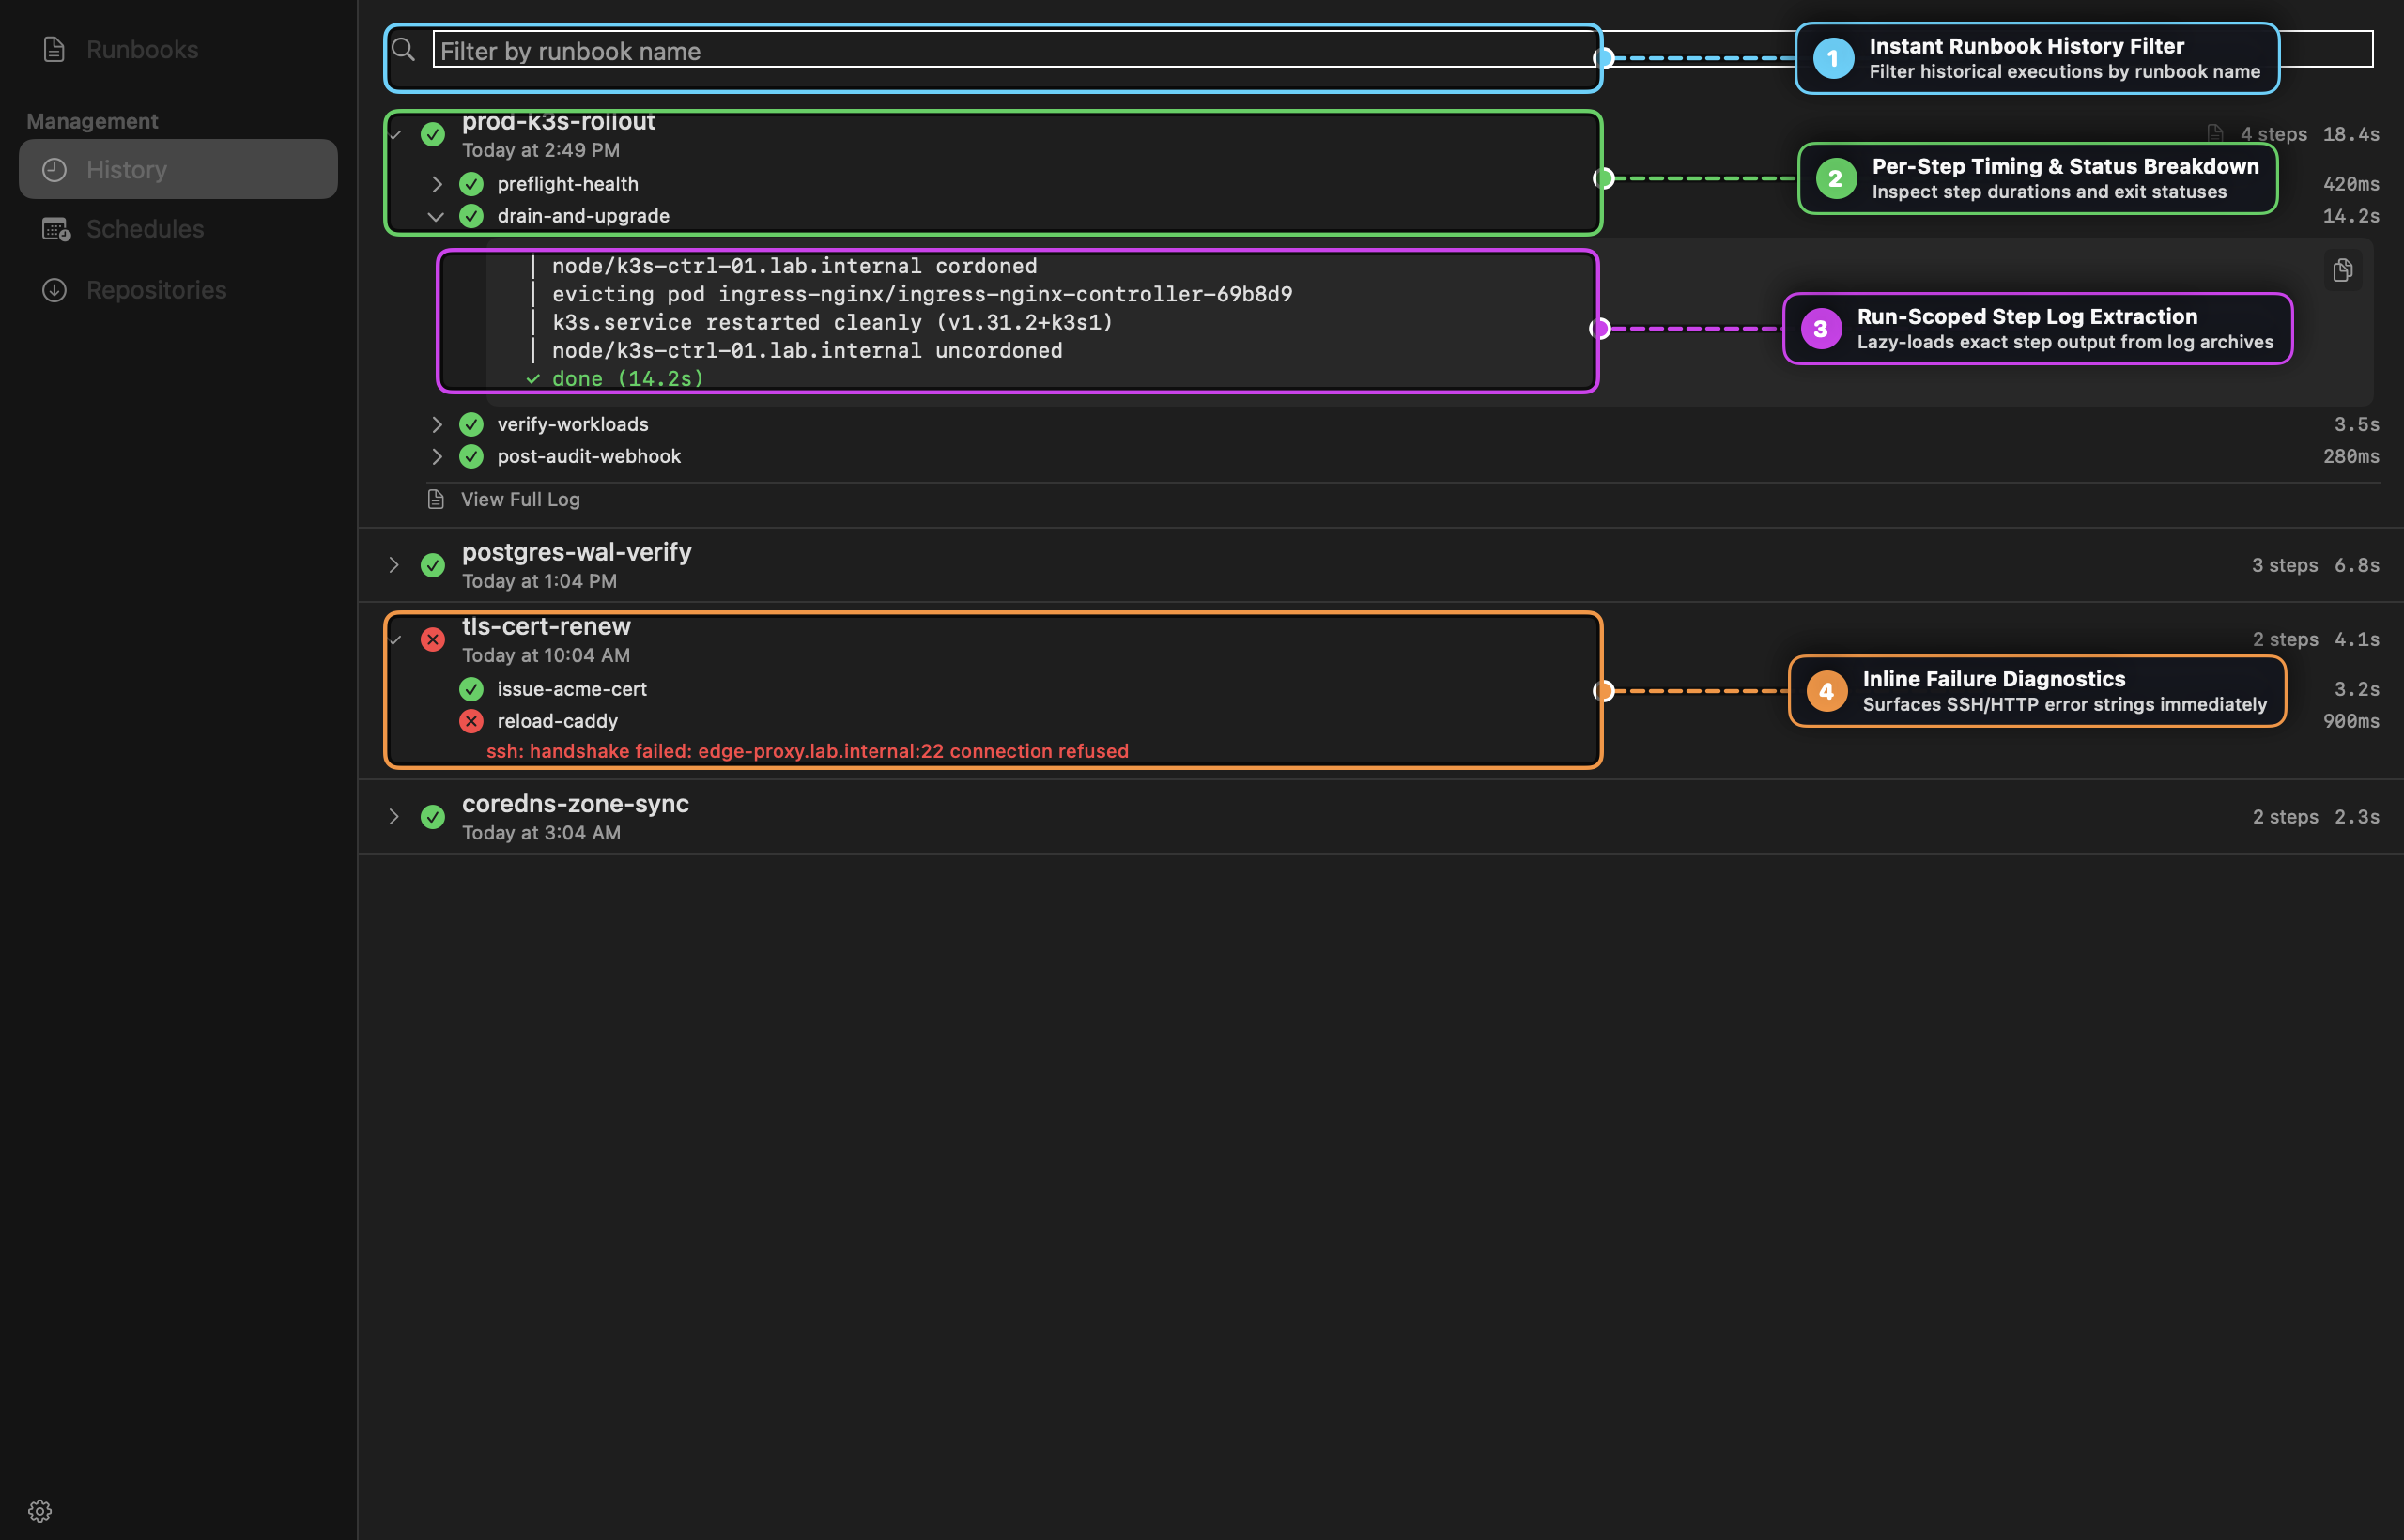
Goal: Diagnose a failed overnight run in seconds without grepping through multi-megabyte append logs.
Step-by-Step
- Switch to History (
⌘2) and type a runbook name into the Filter by runbook name bar (Callout 1). - Locate any failed run (
✗red badge) and click anywhere on the row to expand its per-step breakdown (Callout 2). - Failed steps immediately display their captured error message in red beneath the step name (Callout 4, e.g.,
ssh: handshake failed: edge-proxy.lab.internal:22 connection refused). - Click the chevron next to any step to lazy-load its Run-Scoped Step Log Slice (Callout 3). Runbook scopes the log file to that exact execution timestamp and extracts only the lines emitted by that step.
- Click the copy icon (
doc.on.doc) in the top-right corner of the step log slice to copy the diagnostic output to your clipboard, or click View Full Log at the bottom of the run to browse the entire log file across historical run sections.
Recipe 6: Standardizing Team Playbooks via Pulled Git Collections & Templates
Goal: Share a central repository of operational runbooks and starter templates across machines or team members.
Step-by-Step
- Switch to Repositories (
⌘4) in the sidebar and click Pull Repository. - Enter your team’s Git repository URL (e.g.,
https://github.com/your-org/infra-runbooks.git) and click Pull. - All runbooks in the repository immediately appear in your Runbooks list with a subtle repository badge, while any YAML files under
templates/populate the collapsible Templates section. - To create a new runbook from a team template:
- Right-click the template under Templates and select New from Template.
- Enter a new runbook name, customize the hosts or variables in the YAML editor, and click Create.
Recipe 7: Customizing Console Output Highlighting (~/.runbook/highlights.yaml)
Goal: Highlight custom domain markers (such as Terraform plan changes, Kubernetes statuses, or custom test runners) in the live Console Tray and History log slices.
Step-by-Step
- Create or edit
~/.runbook/highlights.yaml:
rules:
  - pattern: '(?i)\b(ready|active|rolled out|0 to destroy)\b'
    color: green
    bold: true
  - pattern: '(?i)\b(cordoned|evicting|draining|retrying)\b'
    color: orange
  - pattern: '(?i)\b(crashloopbackoff|oomkilled|connection refused|fatal)\b'
    color: red
    bold: true
- Restart Runbook (
⌘Qand reopen). - Both the live Console Tray and History step log slices apply your rules (first-match wins) while automatically turning any
https://...URLs in the output into clickable browser links.